Author: Lorrie Council, Texas Commission on Environmental Quality (TCEQ)
Site Name: H2Oaks Center
Location: Elmendorf, Texas (south of San Antonio, Texas)
Operator(s): San Antonio Water System (SAWS)
Permitting Agency(s): TCEQ
Current MAR Status: Active
Year Constructed: 2004 facility online
Costs: $250,000,000
Project Contact Information: Robert Escobar, SAWS manager, and Kevin Morrison, SAWS project coordinator
Project Website/Publication Links:
Purpose of MAR:
- Water supply resilience
- Resilience/climate adaptation
Source Water:
- Alternative aquifer
Water Quality:
- Pretreatment required (chlorine not required for injection; added by SAWS)
- Post-treatment required (chlorine)
Recharge Technology(s):
- Injection well
Project Description
The SAWS H2Oaks ASR project stores “excess” groundwater for which SAWS has the groundwater rights to use. This excellent-quality groundwater is stored underground in a confined aquifer (reservoir) south of the City of San Antonio. The source water storage is achieved using a large, multi-well ASR project to store the water until it is needed and the water is later recovered via the ASR wells. This ASR project benefits the San Antonio community by ensuring drinking water is available for use during drought and during peak summer water demand periods. Unlike surface water reservoirs, water stored in an ASR project is not subject to evapotranspiration losses.
The ASR project is located on the SAWS H2Oaks Center site, which is an approximate 3,200-acre facility owned by SAWS (Figure 1). The H2Oaks Center ASR has the capacity to store about 233,000 acre-feet of drinking water in a confined aquifer reservoir. The H2Oaks Center also has a brackish water wellfield and associated reverse osmosis water treatment plant that provides an additional water source to the City of San Antonio.
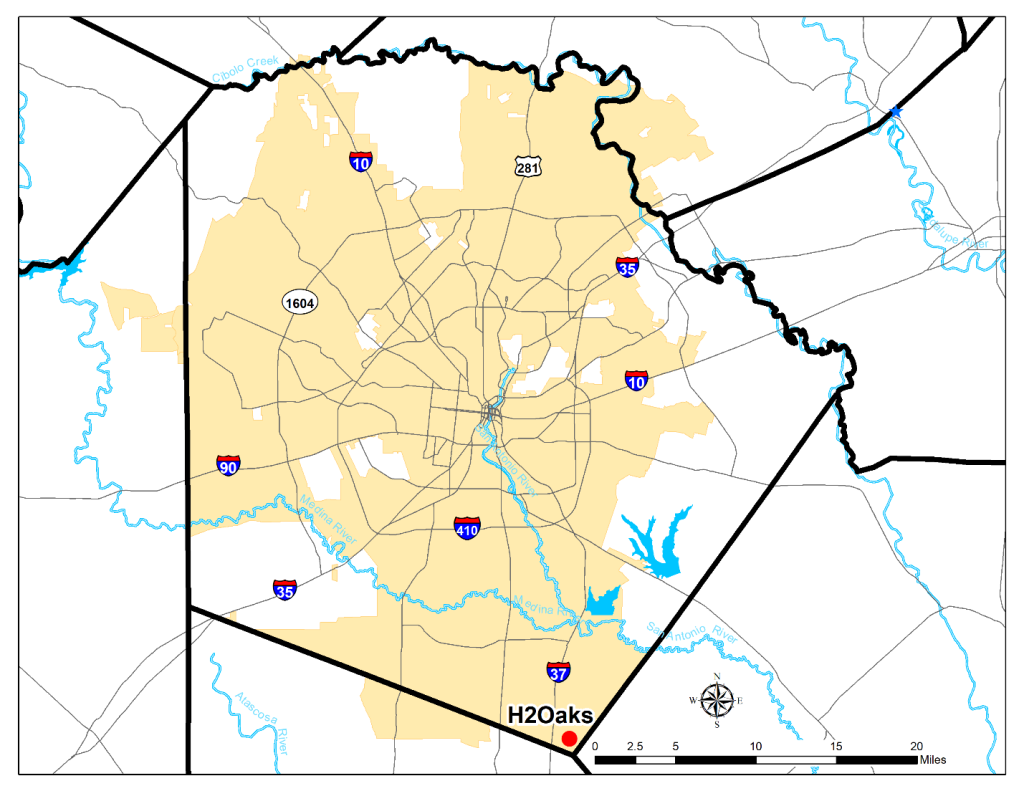
Figure 1. Regional location map: San Antonio Metro Area and H2Oaks ASR project.
Source: Morrison (2022)
Receiving Aquifer
The Carrizo Aquifer is within the Tertiary (Eocene) Carrizo Formation. It is a confined aquifer that occurs at depths beginning ~ 400–700 feet below land surface at the H2Oaks Center ASR project site. The Eocene-age Reklaw Formation is the upper confining unit for the Carrizo Aquifer. The Carrizo Formation is a medium- to very coarse-grained sandstone that includes friable to locally indurated noncalcareous thick bedded sand units.
The H2Oaks ASR has capacity to store 74 million gallons per day. SAWS has installed 29 of 34 permitted ASR wells on the ~3,200-acre facility (Figure 2). The ASR wells have pumping yields that range from 1,200 to 2,000 gallons per minute (gpm). Although the thickness of the Carrizo Sand at the project location is greater, the total thickness of the screened sands in the 29 ASR wells ranges from 145 to 291 feet. The depths to the top of the screens range from 370 to 547 feet below land surface. The average porosity of the Carrizo sands is ~35%.

Figure 2. SAWS H2Oaks ASR well fields.
Source: Morrison (2022)
Water Quality
Source water from the Edwards Aquifer in San Antonio is very high-quality groundwater, and it is stored in the ASR project in the Carrizo Formation. Native groundwater in the Carrizo has higher total dissolved solids (TDS) than the Edwards Aquifer groundwater and has naturally high levels of iron and manganese. Stored water recovered from the ASR project is chlorinated before distribution, and if ASR well production captures native Carrizo groundwater, then treatment for naturally high levels of manganese and iron may be required. The water treatment facility at the H2Oaks ASR project can handle treatment of blended water, including alkalinity adjustments, an aeration system, solids contact clarification, filters, and solids handling.
Performance to Date
The H2Oaks ASR has performed quite well and has operated predominantly in a drought storage mode rather than a seasonal leveling mode. The SAWS H2Oaks ASR water in storage chart (Figure 3) and SAWS H2Oaks ASR production and storage volumes by month chart (Figure 4) depict the ASR water in storage (through August 2022) and ASR production and storage volumes by month (2004 to May 2019). Water in storage has been equivalent to the annual water delivery requirement SAWS has for the City of San Antonio. The ASR project has provided great operational flexibility to the utility in servicing its water customers. The production and storage volumes by month graphic is very informative and shows the dynamics to date of the ASR project through mid-2019.
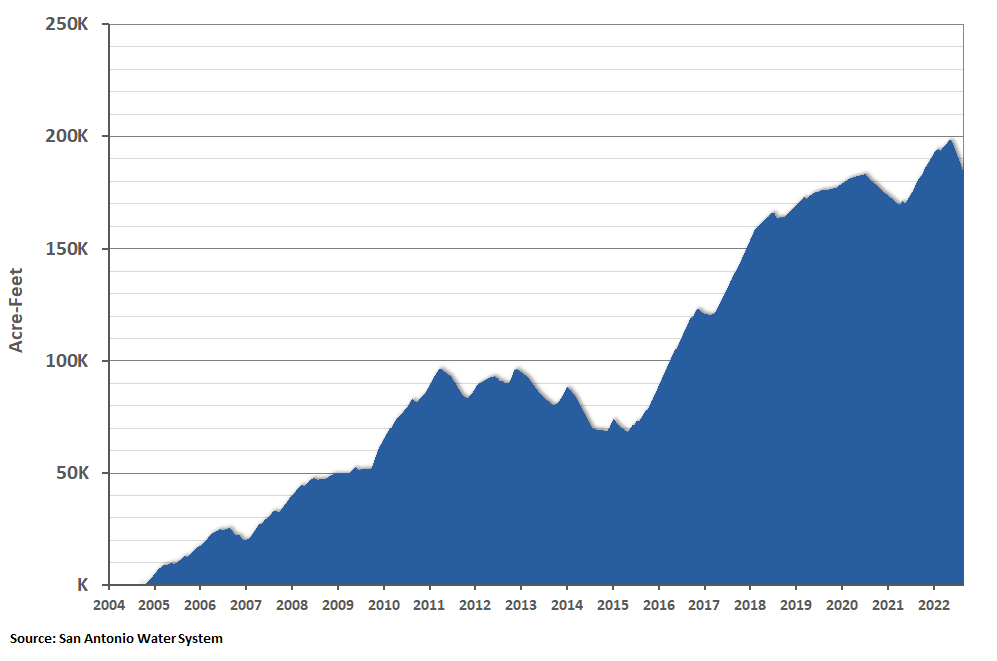
Figure 3. SAWS H2Oaks ASR water in storage.
Source: Morrison (2022)
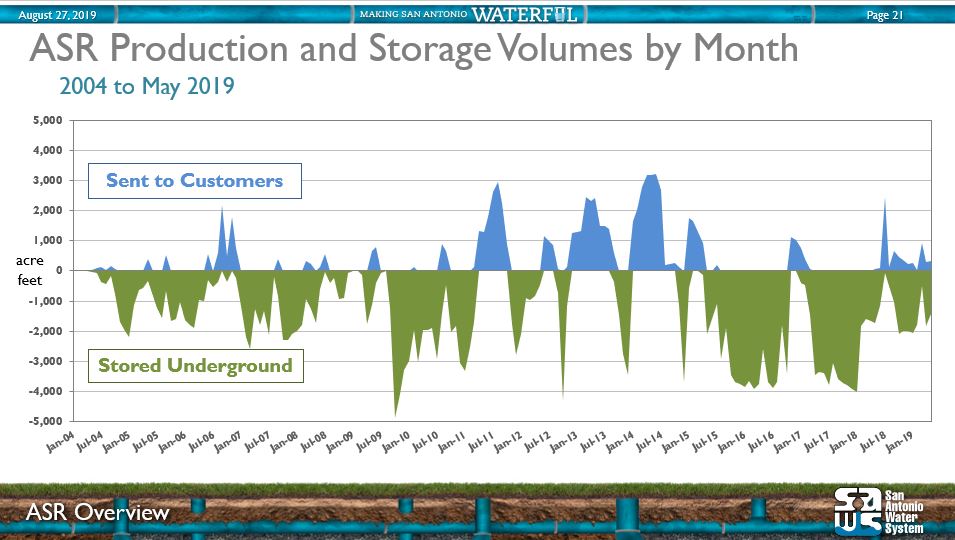
Figure 4. SAWS H2Oaks ASR production and storage volumes by month.
Source: Thompson (2019)
Project Planning/Implementation
Stakeholder Consideration/Issues
SAWS met with landowners and well users in the area during the planning and early implementation phases of the ASR project. Some mitigation was done for nearby eligible well owners to proactively address potential adverse impacts. Wells were individually assessed for mitigation options, such as no mitigation, lower pump, drill replacement well, and connect to water system. As a result, 166 wells were included in this mitigation effort: lowered pump (53), connected to water system (17), drilled new well (83), and no mitigation required (13).
Costs
As of 2019, SAWS estimates it has invested $250,000,000 in the H2Oaks ASR project, which includes 29 total ASR wells, 30 million gallons per day water treatment facility, and seven Carrizo Aquifer wells. Mitigation costs totaled $6,677,000 and included well diagnostics, pump lowering, a replacement well, SAWS meter connection, well plugging, and miscellaneous operational expenses (Thompson 2019). Of this amount, $52 million was for construction of the ASR wellfield, while the remainder was for the pipeline and pumping system to convey the water to and from the ASR wellfield, and for the treatment facilities to treat the high iron and manganese in the water produced from the seven Carrizo Aquifer production wells along one side of the property (Snyder et al. 2022).
Lesson(s) Learned
During the summer of 2022, SAWS conducted a “max recovery” test of the system to determine the ability to aggressively recover (produce) stored water and determine impacts from extended maximum recovery of water from the ASR project. This work served as an extended pump test and the data collected was used to update SAWS’ ASR hydrogeologic model. SAWS also took and analyzed several water chemistry samples during this time. The conclusions of the test were that there is not a lot of movement of stored Edwards Aquifer water within the ASR project boundaries, but there appears to be some mixing occurring on the west end of the project. Over the years, the west side of the ASR project had not received as much Edwards Aquifer water as the east side of the project. SAWS used the updated hydrogeologic model to determine the optimal recovery pumping rate and duration to achieve the balance between storage, recovery, and minimizing downgradient drift of the stored water, while avoiding negative impacts during recovery to nearby wells.
SAWS personnel obtained approval for longer term maintenance and repair of a few ASR wells that have been in service since 2004. To address corrosion issues with the ASR wells, SAWS installed stainless steel liners in the upper portion of two ASR wells that had been operating since project startup in 2004. Additionally, several of the ASR well pumps were replaced. For future ASR wells, SAWS plans to revise its materials of construction to include more corrosion-resistant casing materials.

