Author: Jamie Heisig-Mitchell
Site Name: HRSD Sustainable Water Initiative for Tomorrow (SWIFT) Program
Location: Multiple locations in southeast Virginia
Operator(s): Hampton Roads Sanitation District (HRSD)
Permitting Agency(s): USEPA Region III Underground Injection Control Program
Current MAR Status: Currently operating a 1-million-gallon-per-day demonstration-scale advanced water treatment facility and MAR well in Suffolk, VA, at the SWIFT Research Center.
Year Constructed: 2018
Costs: $26M
Project Contact Information: Dan Holloway, HRSD hydrogeologist, [email protected]
Project Website/Publication Links: https://www.hrsd.com/swift
Purpose of MAR:
- Water supply resilience
- Improving groundwater quality
- Mitigation against saltwater intrusion
- Subsidence reduction
- Reduction of nutrient discharges to surface waters
Source Water:
- Municipal wastewater
Water Quality:
- Pretreatment required
Recharge Technology(s):
- Recharge well
Project Description
SWIFT is an innovative water treatment project in eastern Virginia designed to enhance the sustainability of the region’s long-term groundwater supply, further protect the region’s environment, and help address environmental pressures such as Chesapeake Bay restoration, sea level rise, and saltwater intrusion (Nylen 2021). At full-scale, SWIFT will be implemented at up to five of HRSD’s wastewater treatment facilities with a total recharge capacity of up to 100 million gallons per day.
MAR through the SWIFT program will provide a sustainable source of groundwater to much of eastern Virginia. The need for groundwater in eastern Virginia outstrips the available supply in the Eastern Virginia Groundwater Management Area, prompting the Virginia General Assembly to establish the Eastern Virginia Groundwater Management Advisory Committee and task it with developing, revising, and implementing a management strategy for groundwater in eastern Virginia. A multi-solution plan to address needs and improve management strategies was proposed in the committee report (EVGMAC 2017). Included in this solution set was an evaluation of alternate water sources of which the HRSD SWIFT program was noted as a mechanism for improving the sustainability of the groundwater supply.
The SWIFT program offers the additional benefit of reducing nutrient discharges to Chesapeake Bay. The nutrient reductions resulting from the SWIFT program are sufficient to balance the nutrient reduction needs of the Hampton Roads permitted stormwater localities (Municipal Separate Storm Sewer System (MS4) permittees). The required MS4 nutrient reductions would have necessitated stormwater retrofit projects on a compressed schedule, resulting in a large cost burden to the Hampton Roads community. With the available credits provided by the SWIFT program, localities can more cost-effectively manage stormwater controls through a normal redevelopment cycle and are able to prioritize spending on other community needs, such as climate change adaptation. At full build-out, the SWIFT program will have the capacity to reduce the amount of nutrients discharged to the Chesapeake Bay by up to 85%, equivalent to nearly 1.4 million pounds of nutrients annually, well surpassing the required MS4 reductions estimated at 110,000 pounds annually and surpassing even HRSD’s own discharge requirements by more than 1 million pounds annually.
Further, the SWIFT program is expected to reduce the rate of land subsidence related to the overuse of the aquifer and, in doing so, provide additional time for Hampton Roads localities to implement adaptive measures to address the observed effects of sea level rise. Land subsidence is exacerbated by over pumping from the Potomac Aquifer, resulting in an aquifer compaction rate of up to 3.7 mm/yr, as noted in a U.S. Geological Survey (USGS) report from Eggleston and Pope (2013). This same report found that land subsidence in the region contributes to more than half of the observed sea level rise and noted that increased recharge to the aquifer can mitigate aquifer compaction.
Receiving Aquifer
The target receiving aquifer for SWIFT is the Potomac Aquifer. At over 900 feet thick, it represents the deepest, thickest, and most extensive aquifer in Virginia’s coastal plain (Figure 1). It is laterally extensive across the entire North Atlantic Coastal Plain, except for the area of the Chesapeake Bay Impact Crater. Approximately 75% of the withdrawals in the Virginia Coastal Plain Aquifer system come from the Potomac aquifer and cover many different uses, including potable and non-potable, public and private (Heywood and Pope 2009).
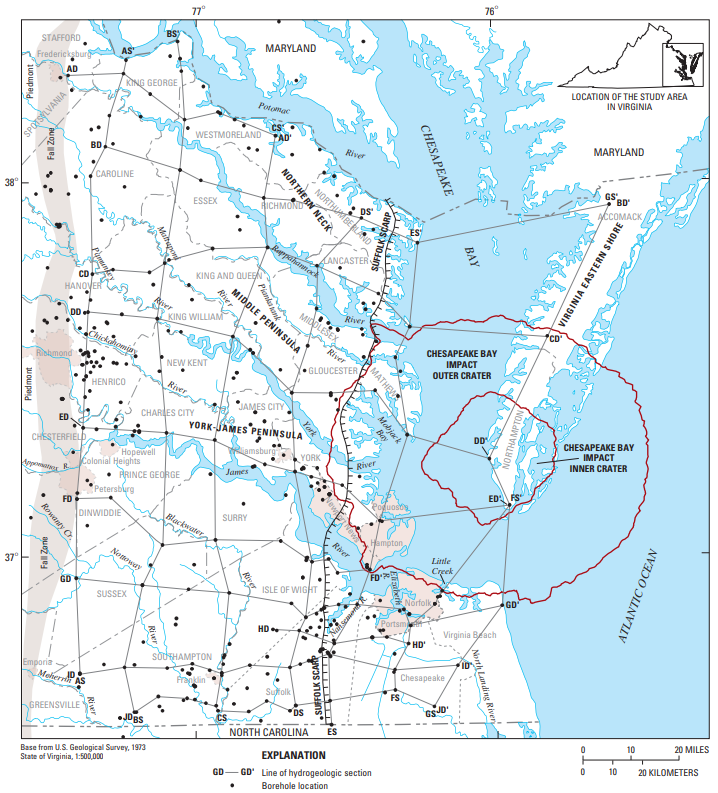
Figure 1. Location of Virginia’s coastal plain.
Source: McFarland and Scott (2006)
As part of the feasibility study for the SWIFT program, HRSD evaluated multiple treatment trains for the advanced water treatment system to identify a train that would produce water of quality that would be compatible with the aquifer system while also providing treatment to meet the needs of public health protection (Martinez et al. 2022). With TDS in the Potomac Aquifer ranging from approximately 700 mg/L to 8,000 mg/L, aquifer compatibility was an important influence in technology selection. Early piloting of a reverse osmosis (RO) treatment train generated a final water product that differed significantly from the chemistry of the native groundwater. The resulting low ionic strength of the RO-treated water relative to the groundwater presents a considerable concern for successful injection operations. This incompatibility posed a high potential for permanent disruption and dispersal of clay particles, clogging pores within the aquifer and reducing aquifer permeability and ultimately injection well capacity.
Parallel piloting of an ozone/biofiltration train demonstrated that the final water was similar to the ionic strength of the upper portion of the Potomac Aquifer and overall, more compatible with the native groundwater. An exhaustive monitoring program also demonstrated the ozone/biofiltration train’s effective removal of pathogens and organic contaminants and compliance with proposed regulatory limits and required thresholds for compounds lacking a regulatory limit (Vaidya et al. 2019). The development of regulatory limits and monitoring requirements is described in further detail below.
In 2018, HRSD began operating a 1-million-gallon-per-day demonstration-scale recharge facility, known as the SWIFT Research Center (SRC), utilizing a coagulation/flocculation/ozonation/biofiltration/GAC adsorption/UV disinfection advanced treatment train. As of the end of September 2022, the facility has successfully recharged more than 600 million gallons to the Potomac Aquifer system. The SRC incorporates a groundwater monitoring network and soil aquifer treatment test columns to inform the fate and transport of solutes present in the recharged water. More information on this work can be found in Bullard et al. (n.d.) and Dziura (2022).
The first full-scale SWIFT facility is being constructed at HRSD’s James River facility, with an anticipated completion at the end of 2025. The full-scale SWIFT process is similar to that of the SRC and is identified in Figure 2. The key elements of the SWIFT treatment train at the 16 million gallons per day facility include coagulation-flocculation-sedimentation, ozone, biofiltration, granular activated carbon, and UV disinfection.
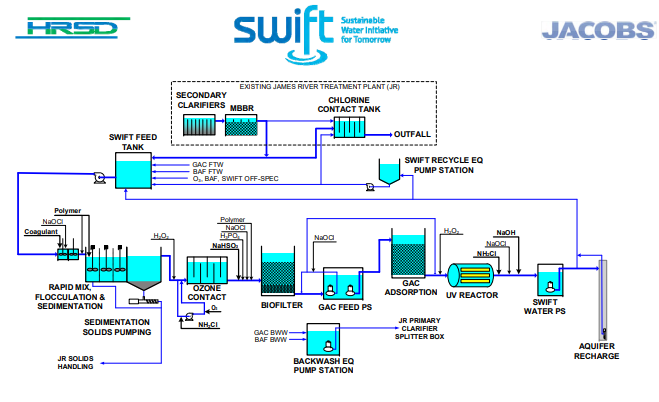
Figure 2. James River SWIFT process flow diagram.
Source: HRSD (2020)
Regulatory Considerations/Issues
The HRSD SWIFT program is permitted through the federal UIC program. Though the Commonwealth of Virginia does not have delegated authority for UIC, an independent oversight committee was convened through legislative action (Code of Virginia. § 62.1.271-275). This Potomac Recharge Oversight Committee (PAROC) serves as an advisory board and is responsible for ensuring that the SWIFT program, including its effects on the Potomac Aquifer, is monitored independently. Technical support to the PAROC is provided by the Potomac Aquifer Recharge Monitoring Laboratory, which is led by codirectors representing the academic institutions: Virginia Tech and Old Dominion University.
HRSD’s first SWIFT project, the 1-million-gallon-per-day demonstration-scale SWIFT Research Center, is authorized by rule under the federal UIC program. In the development of the SWIFT program, the selection of appropriate treatment processes, and the identification of an appropriate regulatory framework, HRSD engaged the expertise of an independent advisory panel through the National Water Research Institute (NWRI) and worked collaboratively with the Commonwealth agencies, the Virginia Department of Health (VDH) and the Virginia Department of Environmental Quality (VDEQ). While much of this regulatory framework is based on the SDWA requirements, in recognition that this program is a potable reuse project, NWRI recommended additional monitoring of indicator compounds as described in the Framework for Direct Potable Reuse (Mosher and Vartanian 2015). Much of this work formed the basis for the regulatory requirements proposed in the draft permit for HRSD’s first full-scale facility, the 16-million-gallons-per-day James River SWIFT (Table 1 and Table 2). NWRI also recommended that the SWIFT process be designed and operated to achieve at least 12 log removal value (LRV) for viruses and 10 LRV for Cryptosporidium and Giardia through a combination of advanced treatment processes and soil aquifer treatment (SAT). A summary of SWIFT process pathogen log removal requirements is depicted in Table 3.
Table 1. James River SWIFT regulatory limits
| Parameter | Regulatory Limit |
| USEPA Drinking Water Primary Maximum Contaminant Levels (PMCL) | Meet all PMCL |
| Total Nitrogen (TN) | 5 mg/L monthly average; 8 mg/L max daily |
| Turbidity | Individual filter effluent (IFE) <0.15 NTU 95% of time and never >0.3 NTU in two consecutive 15-minute measurements |
| Total Organic Carbon (TOC) | 4 mg/L monthly average, 5 mg/L maximum instantaneous |
| Total Coliform | <2 CFU/100 mL 95% of collected samples within one calendar month, applied as the 95th percentile |
| E. coli | Non‐detect |
| TDS | No limit |
Table 2. Required monitoring for James River SWIFT nonregulatory indicators
| Constituent | Category | Threshold Value | Unit | Notes |
| 1,4‐Dioxane | Public health | 1 | µg/L | CCL4; CA notification limit |
| 17‐β‐Estradiol | Public health | 0.91 | ng/L | CCL4 |
| DEET | Public health | 200 | µg/L | MN health guidance value |
| Ethinyl Estradiol | Public health | 2801 | ng/L | CCL4 |
| NDMA | Public health | 10 | ng/L | CCL4; CA notification limit |
| Perchlorate | Public health | 6 | µg/L | CA notification limit |
| PFOA2 | Public health | 4 | ng/L | Draft PMCL |
| PFOS2 | Public health | 4 | ng/L | Draft PMCL |
| TCEP | Public health | 5 | µg/L | MN health guidance value |
| Cotinine | Treatment effectiveness | 1 | µg/L | Surrogate for low molecular weight, partially charged cyclic chemicals |
| Primidone | Treatment effectiveness | 10 | µg/L | |
| Phenytoin | Treatment effectiveness | 2 | µg/L | |
| Meprobamate | Treatment effectiveness | 200 | µg/L | High occurrence in wastewater treatment plant effluent |
| Atenolol | Treatment effectiveness | 4 | µg/L | |
| Carbamazepine | Treatment effectiveness | 10 | µg/L | Unique structure |
| Estrone | Treatment effectiveness | 320 | ng/L | Surrogate for steroids |
| Sucralose | Treatment effectiveness | 150 | mg/L | Surrogate for water soluble, uncharged chemicals with moderate molecular weight |
| Triclosan | Treatment effectiveness | 2,100 | µg/L | Chemical of interest |
| 1 Threshold value identified in Monitoring Strategies for Contaminants of Emerging Concern (CECs) in Recycled Water, Recommendations of a Science Advisory Panel, 2018; SCCWRP Technical Report 1032. 2 Though no thresholds have been established, monitoring and reporting will include PFBA, PFHpA, PFHxS, and PFNA. | ||||
Table 3. Summary of treatment process pathogen log removal requirements.
| Parameter | Floc/Sed (+BAF) | Ozone | BAF+GACC | UV | Cl2 | SAT1 | Total |
| Enteric Viruses | 2 | 0 | 0 | 4 | 0 | 6 | 12 |
| Cryptosporidium | 4 | 0 | 0 | 4 | 0 | 6 | 14 |
| Giardia | 2.5 | 0 | 0 | 4 | 0 | 6 | 12.5 |
| 1 At least 6‐log credit for viruses, Cryptosporidium, and Giardia is expected through SAT based on the modeled travel time of the recharge water in the Potomac Aquifer system. Literature has demonstrated additional treatment of recharge water as it moves through an aquifer system; the California Department of Health Regulations Related to Recycled Water state that 1‐log virus reduction credit is granted for every month the water is in the ground up to 6‐log reduction (California Code of Regulations Title 22 §60320.108). A minimum 6‐log removal of Cryptosporidium and Giardia is expected when achieving 6‐log virus reduction. HRSD’s soil column testing has confirmed this assumption. | |||||||
| Floc/Sed – flocculation/sedimentation; BAF – biologically active carbon filtration; GAC – granular activated carbon; UV – ultraviolet; SAT – soil aquifer treatment; C12 – carbon chain | |||||||
PAROC was actively engaged in reviewing and affirming the regulatory monitoring requirements for James River SWIFT. As part of the James River SWIFT UIC permit application process, HRSD again sought input on monitoring requirements from NWRI, VDH, and VDEQ—the latter two agencies acting on behalf of the PAROC. Through this process, additional monitoring requirements were incorporated at the request of NWRI and/or PAROC. Male-specific and somatic coliphage monitoring was a requested addition from NWRI to serve as an indicator of viral pathogen reduction.
The HRSD SWIFT program offers a One Water solution, addressing challenges across multiple water sectors:
- meeting water supply needs by providing sustainable groundwater inputs,
- meeting the needs for additional nutrient reductions from our wastewater facilities and our local stormwater management programs, and
- supporting Chesapeake Bay restoration efforts.
This was all accomplished through a highly collaborative process and engagement with national experts, state and federal regulatory agencies and local stakeholders.

